Is the frequency domain a real place?
Dissing Fourier, exploring the Hadamard-Walch transform, and making square-wave spectrograms.
In an earlier article on the Fourier transform, I talked about the frequency domain — a wondrous mathematical place where complex signals are transmuted into the amplitudes and phases of sine waveforms. The frequency domain allows us to perform all kinds of signal processing tricks that seem nearly impossible to pull off when we stare at the data in its most straightforward form — that is, in the time domain (or the spatial domain).

At the end of that deep dive, I left one question unanswered: how real is this frequency place, anyway? The discrete Fourier transform (DFT) plays a central role in communications and signal processing — but does it reveal some deeper, unseen truth about the universe? For example, do square waves exist at all? After all, the transform turns them into a series of odd-numbered sine harmonics. Is that all there is to reality?…
Today, I’d like to knock the Fourier transform off the pedestal. To be sure, sine waves are ubiquitous in nature, so this analytical tool is well-suited for a number of tasks. That said, it’s eminently possible to construct other well-behaved frequency domains that play by different rules — including one where only square waves are real, and everything else is just harmonics.
Revisiting discrete cosine transform (DCT)
To get started, let’s circle back to discrete cosine transform — a simplified, real-numbers-only version of DFT. From the earlier article, you might recall the following DCT-II formula:
The operation boils down to taking a series of input values (sn — say, audio samples), multiplying each by the value of a particular cosine expression, and then summing the result to get the magnitude reading for a particular frequency bin (Fk).
The construct at the heart of this algorithm is the cos() expression that generates a sine wave with a frequency corresponding to the number of the current DCT bin. This is known as the basis function; we can abstract it away and rewrite the formula as:
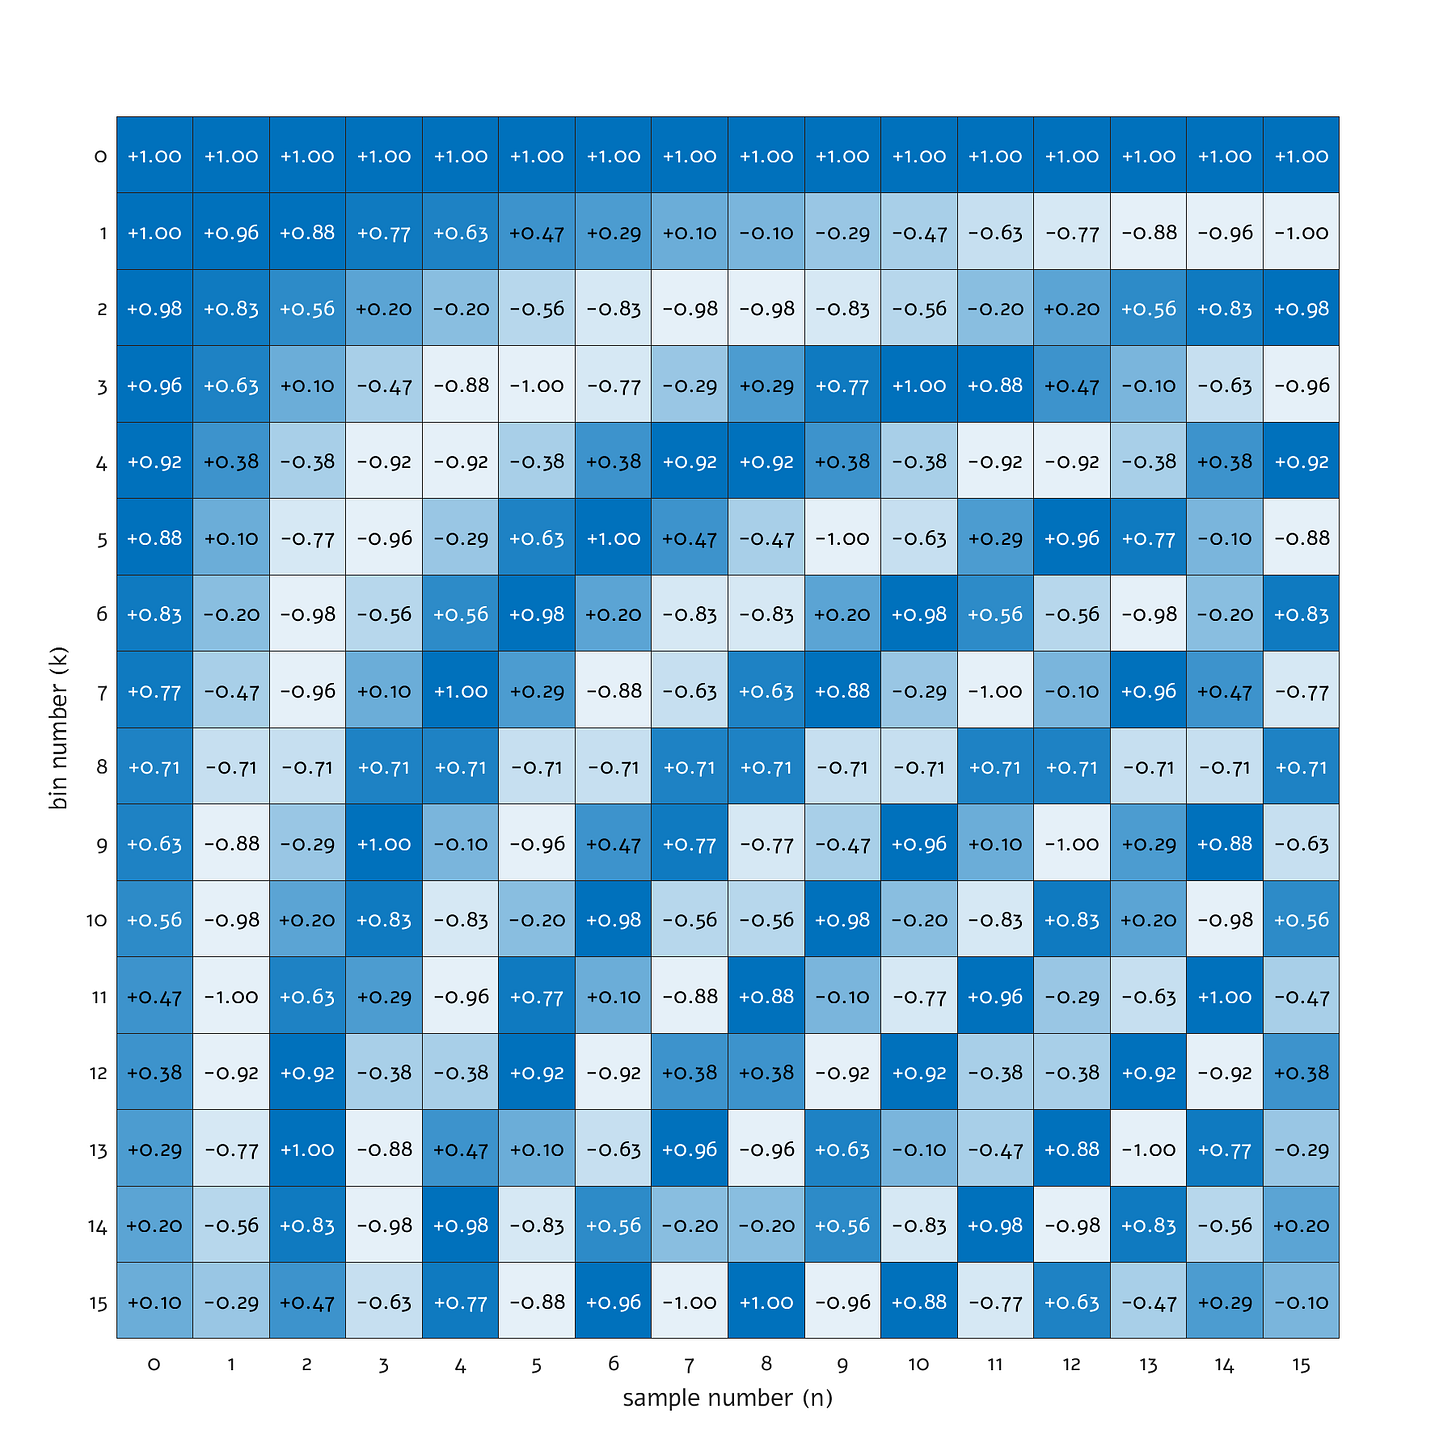
In this generalized notation for a frequency-domain transform, B(k, n) returns some sort of a multiplier based on the values of k and n. Software engineers might find it intuitive to think about B(k, n) as a lookup array. In fact, let’s calculate that array — a matrix in the math parlance — for N=16:
If you remember the operation of DCT, this visual should be easy to parse. The first row (k=0) corresponds to the DC component — i.e., a cosine “running” at 0 Hz, perpetually stuck at +1.00. The next row contains a cosine completing one half of a cycle, going from +1.00 to -1.00; this is followed by a full cycle at k=2, a cycle and a half at k=3, and so on.
Into the square-verse!
So, how does one go about building a new basis function that splits signals not into sine frequencies, but into square waves? Foreshadowing a bit, the answer appears almost ridiculously simple:
This is known as the Walsh matrix. It essentially consists of square waves running at different speeds, although with some complex symmetries thrown in. And yes: every multiplier is just a +1 or a -1, so the computation boils down to flipping some signs in the input data and then summing the results.
The matrix looks fairly trivial, but there’s more to it than meets the eye. To capture all frequency and phase information, the rows have increasing sequency — that is, each next row has just one more sign flip than the one before. Further, the pattern is carefully engineered to ensure orthogonality — the fragile input-output symmetry that allows seamless conversions back and forth between the frequency representation and the original time-series data.
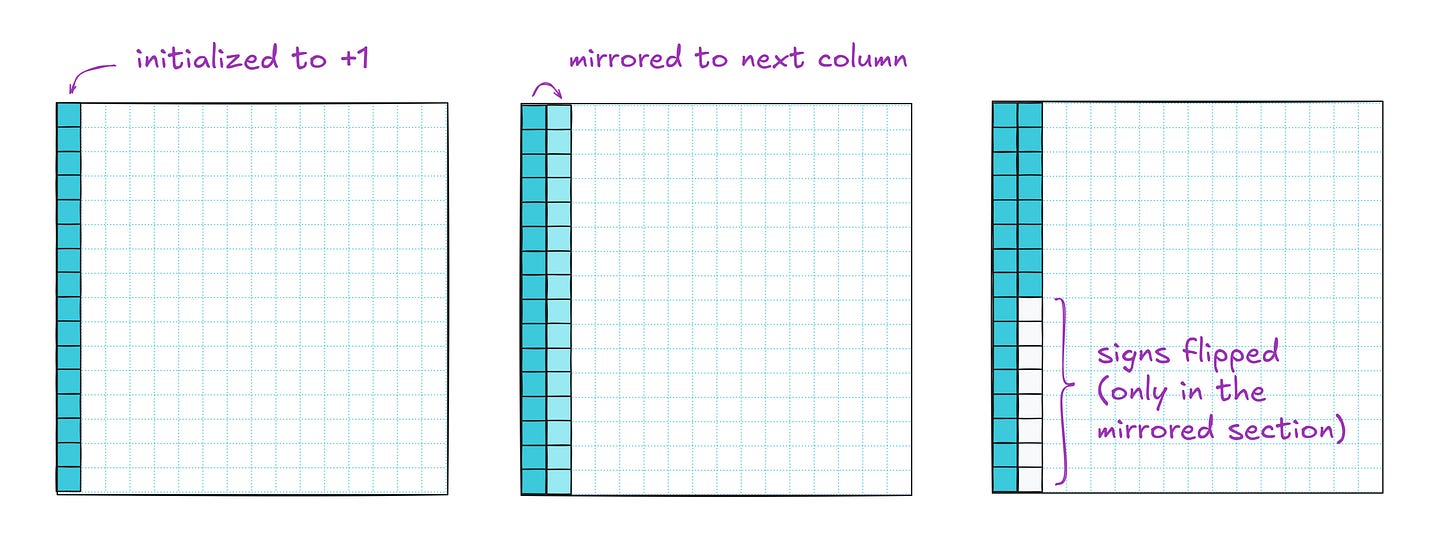
A direct way to construct the Walsh matrix would be an iterative process. I haven’t seen it described this way on the internet, but the structure is fairly easy to reverse-engineer. We start with an empty N×N array, where N is a power of two. We put +1 in every row of the leftmost column (#0), and then generate column #1 by making a mirror copy these values. Next, we divide the newly-added column into two halves and flip the signs in the bottom half:
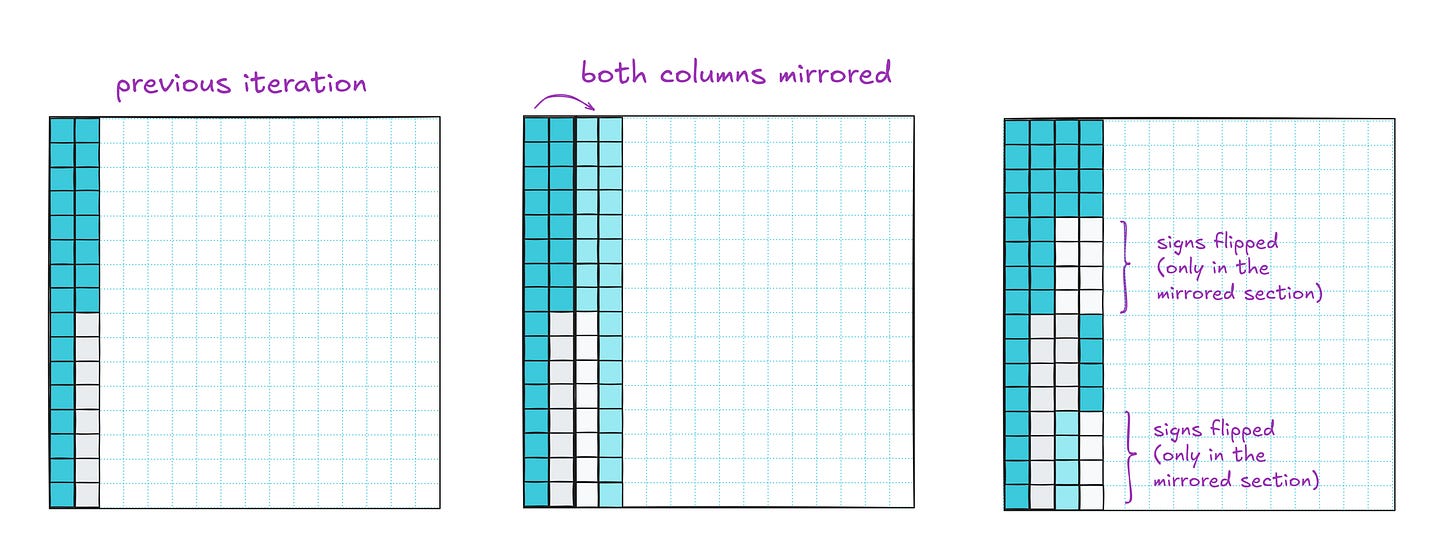
In the second iteration, we follow a similar process: we make a mirror copy of the existing two columns to fill in the next two. After that, we divide the newly-added columns into twice as many horizontal buckets as before (4), and flip the signs in every other bucket:
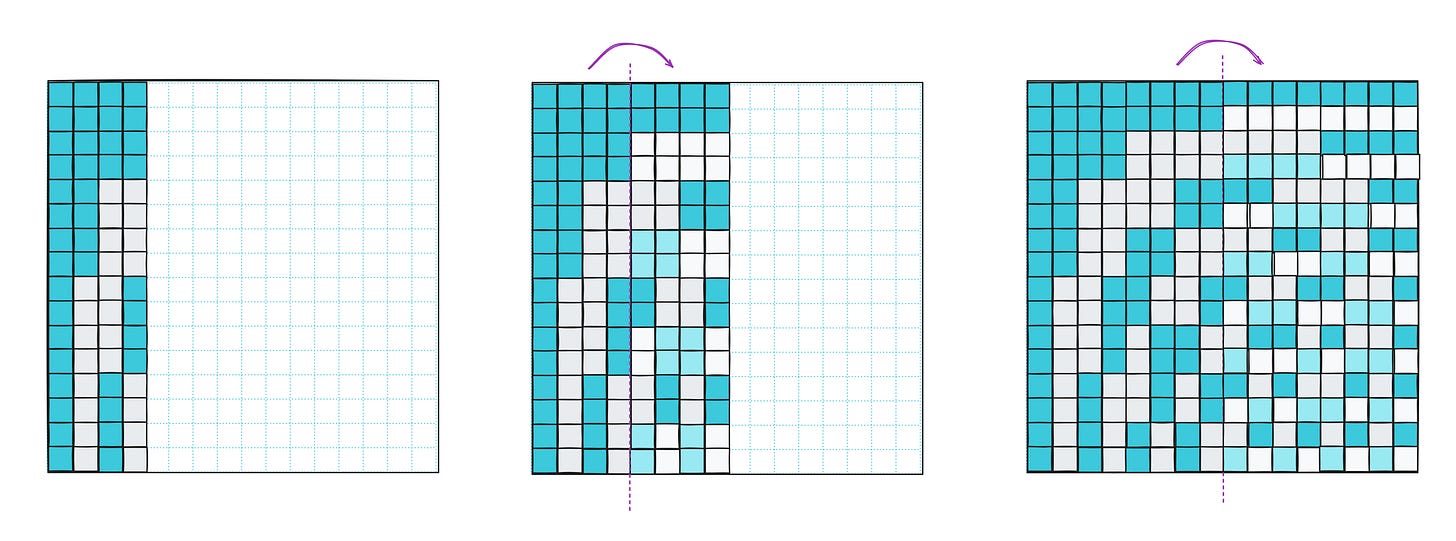
After that, we mirror all four columns and divide the rows into eight buckets for sign-flipping. One more iteration and we’re done:
This approach works, but in scholarly articles and in open-source code, the Walsh layout is instead derived from something known as the Hadamard matrix. For N=16, this intermediate matrix looks the following way:
And… what’s up with that?
Getting to know Mr. Hadamard
At a glance, the plot looks chaotic, but it’s simply a reordering of the Walsh layout. For example, row #15 is moved to #1, while the original #1 now sits at #8.
For the most part, starting with this structure is just a matter of historical convention: Hadamard described his construction first, and Walsh built on top of that. But as a matter of practicality, the methods for constructing the Hadamard matrix are documented better, and one of the approaches is a simple and efficient bit-twiddling hack.
But first, let’s have a look at the textbook approach. We start with the following trivial 1×1 array:
From there, we iteratively extend it by taking the array generated in the previous step (Hn-1) and tiling four copies of it on a grid with twice the original dimensions. The first three copies are verbatim, and the final one — bottom right — has all the signs flipped. The mathematical notation for this extension is:
The fancy operator (⊗) is known as the Kronecker product, but it’s really just glorified copy-and-paste. The first extension — consisting of four copies of H0 — looks the following way:
Another iteration makes four copies of H1, producing this layout:
…and so on. The size of the resulting Hadamard matrix is always 2n×2n, where n is the number of construction steps we went through.
As hinted earlier, there’s also a cute bitwise arithmetic trick we can employ to get the same result: as it turns out, the value of the Hadamard function at a particular cell can be divined by calculating x & y and then checking if the number of bits set in the result is even or odd. The following C code implements this algorithm, and then displays an 8×8 Hadamard matrix on the screen:
#include <stdint.h>
#include <stdio.h>

#define HD_LEN_POW2 3
#define HD_LEN      (1 << HD_LEN_POW2)

int8_t hadamard(uint32_t x, uint32_t y) {
  return (__builtin_popcount(x & y) % 2) ? -1 : 1;
}

int main() {
  for (uint32_t y = 0; y < HD_LEN; y++) {
    for (uint32_t x = 0; x < HD_LEN; x++) printf("%+d ", hadamard(x, y));
    putchar('\n');
  }
}
It would take us too much time to explain this trick here, but the mechanism nearly identical to what’s described in a separate article on the bit-twiddled Sierpiński triangle. In fact, the Hadamard matrix is essentially a corruption of the pattern outlined there.
In principle, this uglier matrix is sufficient to construct a frequency-domain transform. That said, its ordering of the frequency bins is unintuitive, so let’s try to fix that before we leave.
Enter Mr. Walsh
To turn the Hadamard matrix in the nicely-ordered flavor showcased earlier, we need to sort the rows based on their sequency.
The most straightforward way, found in just about every reference implementation, is just to count the number of sign changes in each row. That said, a reader pointed out another clever bit-twiddling hack: for an array with 2n rows, Hadamard row mappings can be computed by XORing Walsh row numbers with their own value shifted by a single bit to the right, and then reversing the order of the last n bits.
Here’s an implementation that does just that and prints a sorted 8×8 array on the screen:
#include <stdint.h>
#include <stdio.h>

#define HD_LEN_POW2 3
#define HD_LEN      (1 << HD_LEN_POW2)

int8_t hadamard(uint32_t x, uint32_t y) {
  return (__builtin_popcount(x & y) % 2) ? -1 : 1;
}

uint32_t to_graycode(uint32_t val) {
  return val ^ (val >> 1);
}

uint32_t reverse_bits(uint32_t val, uint8_t bit_cnt) {
  uint32_t res = 0;
  while (bit_cnt--) { res <<= 1; res |= (val & 1); val >>= 1; }
  return res;
}

int8_t walsh_array[HD_LEN][HD_LEN];

void precompute_walsh() {
  for (uint32_t y = 0; y < HD_LEN; y++) {
    uint32_t hd_y = reverse_bits(to_graycode(y), HD_LEN_POW2);
    for (int x = 0; x < HD_LEN; x++) walsh_array[y][x] = hadamard(x, hd_y);
  }
}

int main() {
  precompute_walsh();
  for (uint32_t y = 0; y < HD_LEN; y++) {
    for (uint32_t x = 0; x < HD_LEN; x++) printf("%+d ", walsh_array[y][x]);
    putchar('\n');
  }
}
Equipped with this, we can gut the DCT implementation and make a “discrete square transform” and its inverse:
...previous code here, sans main()...

void sqft(double* out_buf, double* in_buf, uint32_t len) {

  for (uint32_t bin_no = 0; bin_no < len; bin_no++) {
    double sum = 0;
    for (uint32_t s_no = 0; s_no < len; s_no++)
      sum += in_buf[s_no] * walsh_array[s_no][bin_no];
    out_buf[bin_no] = sum;
  }

}

void isqft(double* out_buf, double* in_buf, uint32_t len) {

  for (int s_no = 0; s_no < len; s_no++) {
    double sum = 0;
    for (int bin_no = 0; bin_no < len; bin_no++)
      sum += in_buf[bin_no] * walsh_array[bin_no][s_no];
    out_buf[s_no] = sum / len;
  }

}
Technically, this is called the Walsh–Hadamard transform (WHT), but never mind. Let’s confirm that it works:
...continuing from the previous snippet...

void print_buf(const char* prefix, double* buf, uint32_t len) {
  printf("%s", prefix);
  for (uint32_t i = 0; i < len; i++) printf(" %+.2f", buf[i]);
  putchar('\n');
}

int main() {

  double in[HD_LEN] = { 1, 1, 1, 1, 5, 5, 5, 5 };
  double sq_freq[HD_LEN], out[HD_LEN];

  precompute_walsh();
  sqft(sq_freq, in, HD_LEN);
  isqft(out, sq_freq, HD_LEN);

  print_buf("Input :", in, HD_LEN);
  print_buf("SQFT  :", sq_freq, HD_LEN);
  print_buf("ISQFT :", out, HD_LEN);

  return 0;
}
The input is a square-wave-ish sequence of numbers: 1 1 1 1 5 5 5 5. The output from DFT or DCT would be a bunch of harmonics across multiple frequency bins:
DCT : +24.00 -10.25 -0.00 +3.60 +0.00 -2.41 -0.00 +2.04
In contrast, the frequency-domain representation generated by the program shows non-zero components only in F0 (DC) and F1, confirming that we have an algorithm that deconstructs the signal into pure square waves:
SQFT : +24.00 -16.00 +0.00 +0.00 +0.00 +0.00 +0.00 +0.00
Finally, we can verify that the inverse function — isqft() — transforms the frequency domain back to what we started with:
ISQFT : +1.00 +1.00 +1.00 +1.00 +5.00 +5.00 +5.00 +5.00
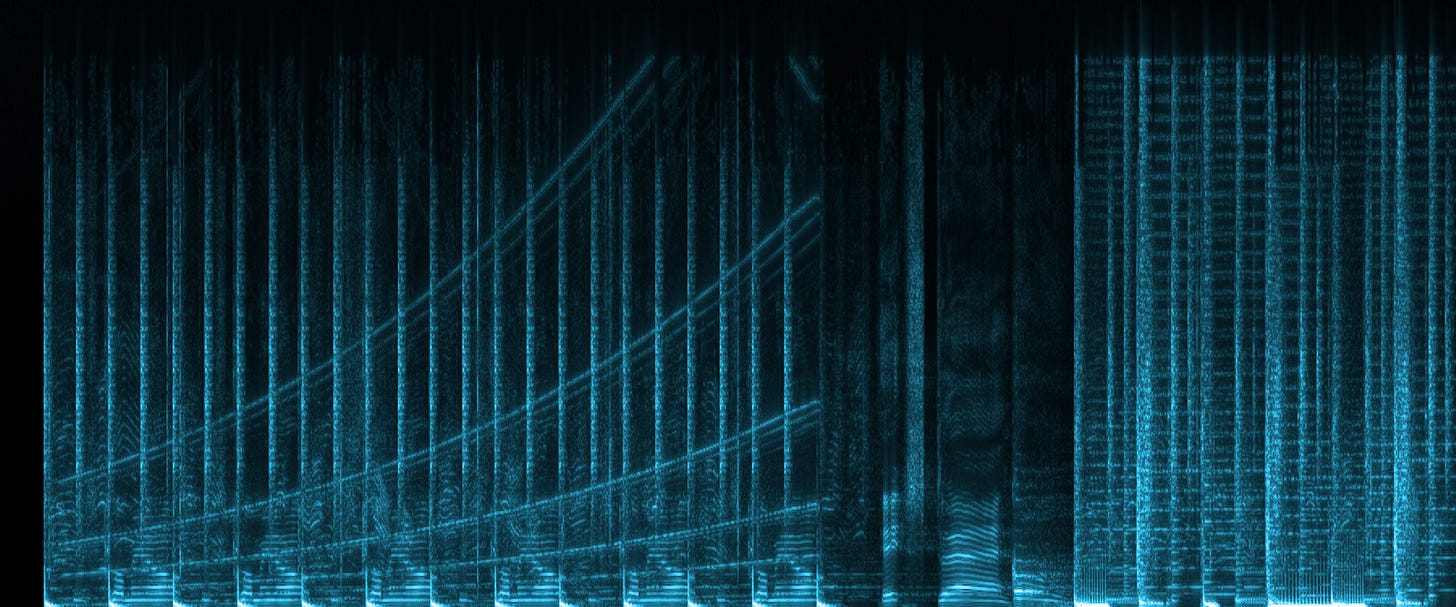
I couldn’t find any visual comparisons of the algorithms’ outputs, so I prepared my own. Here’s the quasi-conventional DCT spectrogram of an 🔈 11-second clip from “DARE” by Gorillaz:
…and here’s the cool-looking Walsh-Hadamard equivalent:
The Walsh-Hadamard transform, being computationally efficient on potato-class computers and well-suited for certain types of data, finds uses in a couple of niches. The point isn’t that it needs to be used more; it’s just that discrete Fourier doesn’t have a monopoly on truth.
👉 For more articles on electronics, click here.
I write well-researched, original articles about geek culture, algorithms, and more. If you like the content, please subscribe. It’s increasingly difficult to stay in touch with readers via social media; my typical post on X is shown to less than 5% of my followers and gets a ~0.2% clickthrough rate.




PS Here's a person experimenting with Walsh-Hadamard for image compression: http://rotormind.com/blog/2019/hadamard-days-night/
Plus, some technical details about the spectrograms shown at the bottom. They were calculated with DCT and WHT from a 44.1 kHz mono audio file. Input sample window was 512 with a transform stepover of 1, producing an output array with dimensions around 512 x 485k. Pixel intensities correspond to normalized absolute values with a gamma of around 0.4 (i.e., pixel = fabs(orig_value / window_size) ^ 0.4)). The image was then resized with Lanczos resampling, and rendered with a linear black - sky blue - white colormap.
This is a great article, but for future ones, could you use Rust instead of C for any code? Rust is now the preferred programming language for code examples.