You can't handle the Buddhabrot!
Exploring the little-known sibling of the world's most famous fractal.
In today’s episode, let’s talk about fractals, floating point numbers, and why that one guy on Wikipedia is wrong.
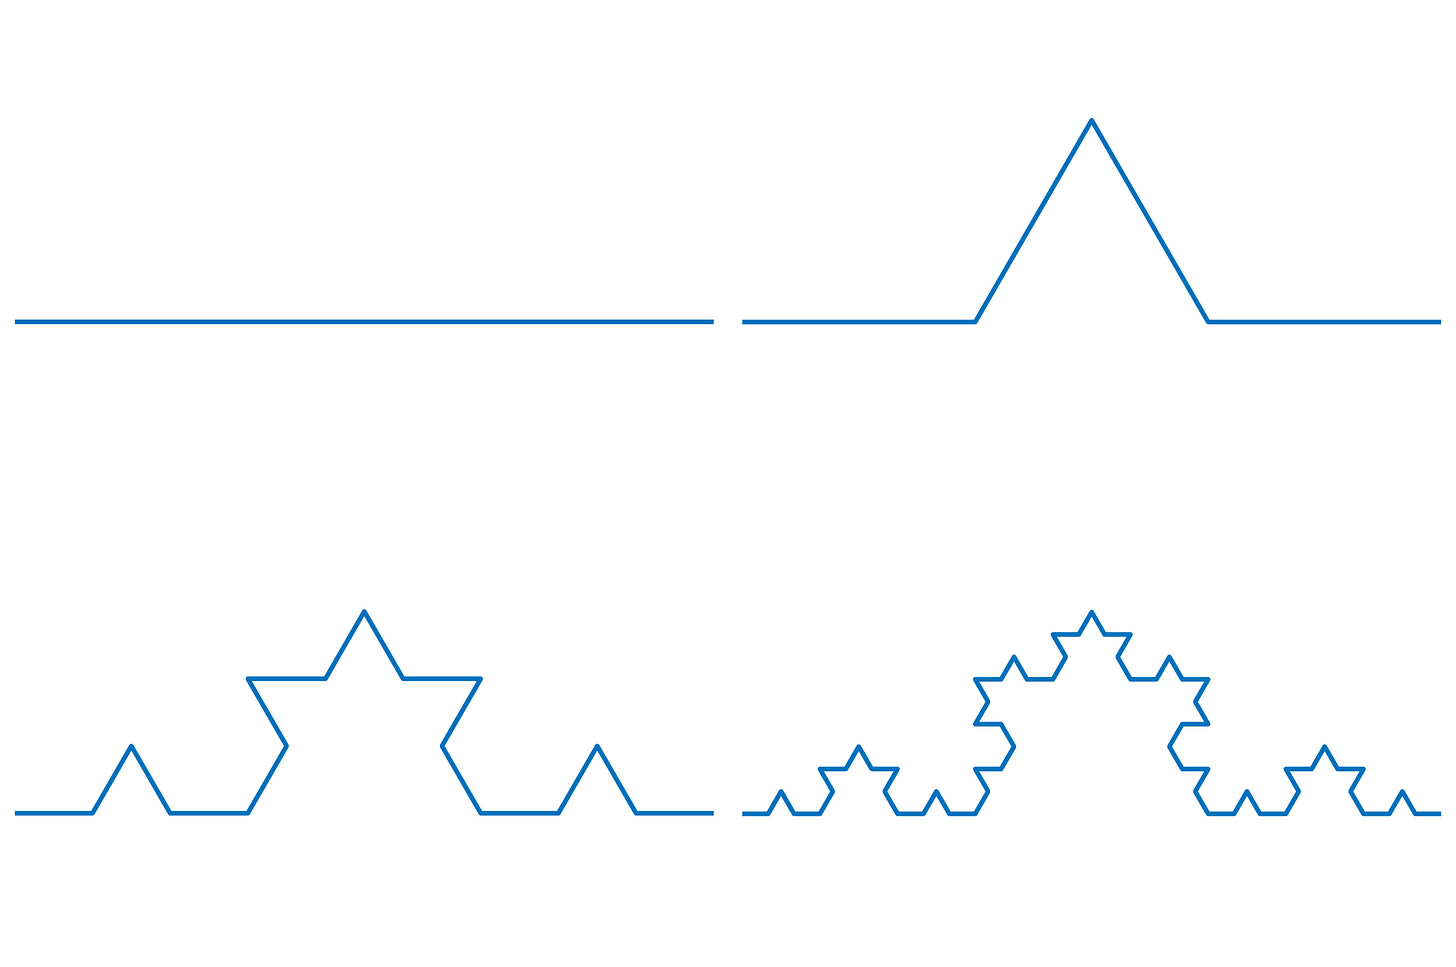
First things first: if you’re unfamiliar with the term, fractals are a loosely-defined class of geometric shapes with an infinitely repeating, self-similar structure that’s evident no matter how much you zoom in. A rudimentary example is the Koch curve, which can be constructed by repeatedly dividing every straight line into three equal parts, and then adding a fourth segment to form a “spike”. Keep doing this forever and presto — a fractal:
In addition to being constructed on purpose, fractal patterns keep showing up in the solutions to a number of useful functions, usually near where the function is exhibiting high rates of separation — that is, rapid divergence of results in response to vanishingly small differences in input values. The study of such systems is of considerable scientific interest: they are deterministic yet hard to predict if you don’t have a perfect knowledge of the system’s state. They are a boon to cryptographers and the bane of weather forecasts.
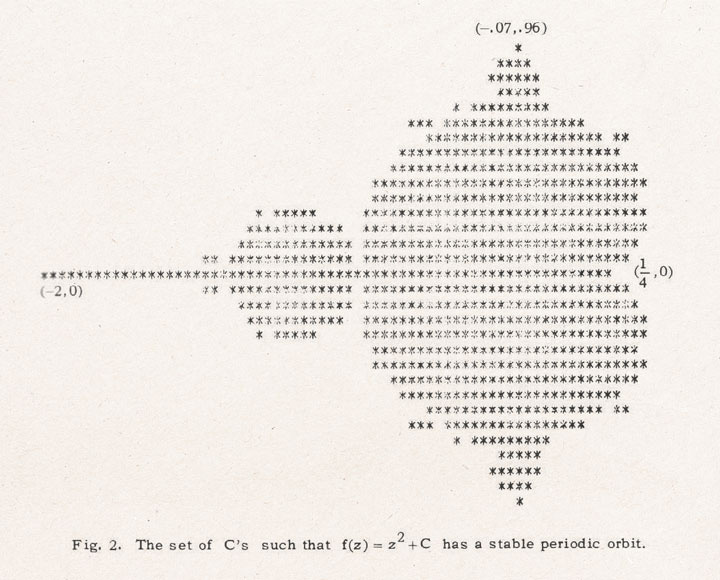
As for the fractals themselves, they come with some interesting theoretical underpinnings too — but for the most part, they function as visual curiosities. The most famous example is the Mandelbrot set, named after Benoit Mandelbrot and first portrayed on this printout from 1978:
The core construct of the Mandelbrot set is the following iterated formula:
Both variables — z and c — are complex numbers. The value of c corresponds to the coordinates of the pixel we’re currently drawing; for the purpose of the computation, the image is usually scaled to -2 … 1.5 in the horizontal direction and -1.5 … 1.5 vertically. The value of z0 is initialized to zero. Subsequent zn values represent the position of a point in space that moves around with every iteration. Its motion is used to decide how to color the current pixel c, but zn itself is not displayed on the screen.
Before we talk about the coloring algorithm, we should probably talk about complex numbers. I explain them in more detail in this companion article, but in this instance, we can say they’re mostly just a trick to combine two Cartesian coordinates — (x, y) — into a single number while still keeping them separable.
It’s akin to inventing a magic value of 🐱, which is not a number, with the rule that any🐱-attached terms in an expression can’t be commingled with the catless stuff:
The catless stuff (1 + 3 = 4) is called the real part; it could represent the horizontal axis. The cat domain (2 + 10 = 12) is called the imaginary part, conventionally representing position on the vertical axis. In other words, we could write the following in the context of the Mandelbrot formula:
In a more serious article, we’d trade the cat for a mathematical token known as i, but the mechanics would mostly remain the same.
To get rid of the complex numbers, we can convert the formula to a pair of new formulas that operate separately on the real (x) and imaginary (y) parts. That said, because we have two different complex numbers, we can’t use x and y for both; let’s replace zn with xn + iyn and c with u + iv. With these changes, the earlier zn+1 = zn² + c formula can be restated as:
The zn² part can be further expanded by following the normal rules for the square of a sum: (a + b)² = a² + 2ab + b².
The first term of the expansion (xn²) is real. The second term (2ixnyn) contains i, so it’s stuck in the imaginary realm. But what about the third one?
Well, at this point, we need to note that the i system differs from the cat-based model in an interesting way. For reasons explained in the aforementioned companion article, i is not entirely abstract; instead, it’s defined as √-1. This value is not a real number (in the sense that it doesn’t have a place on the real number line), so most of the time, it just sits there and looks weird. That said, if we square it, it yields a real number: (√-1)² = -1.
In other words, the expansion of zn² becomes:
Now that we have the zn² part of the zn+1 = zn² + c equation untangled, we also need to add the c = (u + iv) term. With this done, we’re free to reorder the final expression and pluck out the real and imaginary (i-coupled) parts to build a pair of ordinary coordinates:
Now that we have a standard real-number formula, we can approximate the Mandelbrot set by calculating about 1,000 steps of the (xn, yn) sequence for every screen coordinate (u, v). Again, we always start at x0 = 0 and y0 = 0. We then mark the (u, v) pixel as a part of the fractal if the iterated series of (xn, yn) coordinates never escapes radius r ≥ 2 around the center of the coordinate system.
The basic Mandelbrot visualization has just two colors, but to add some flair, we can also color the pixels outside the perimeter based on their “escape velocity” — that is, how quickly they bailed out:
With the right shading, the resulting Mandelbrot set is pretty, but it’s also fairly bland: all the fractal features are clustered along the perimeter and there is a huge void in the middle. Luckily, there is another remarkable way to visualize this set — or rather, the fate of the pixels that don’t get sucked into the black hole.
Follow it… if you can
As it turns out, it’s not just the boundary of the Mandelbrot set that’s mind-bogglingly complex: the same goes for the successive (xn, yn) coordinates produced for c = (u, v) parameters near the set’s edge. The iterated values follow elaborate, long-winded paths through space; their ethereal trails can be visualized using a density plot reminiscent of the Mandelbrot fractal itself. At low iteration counts, this similarity is quite pronounced:
That said, when iterated over longer timescales, the new set develops a character of its own:
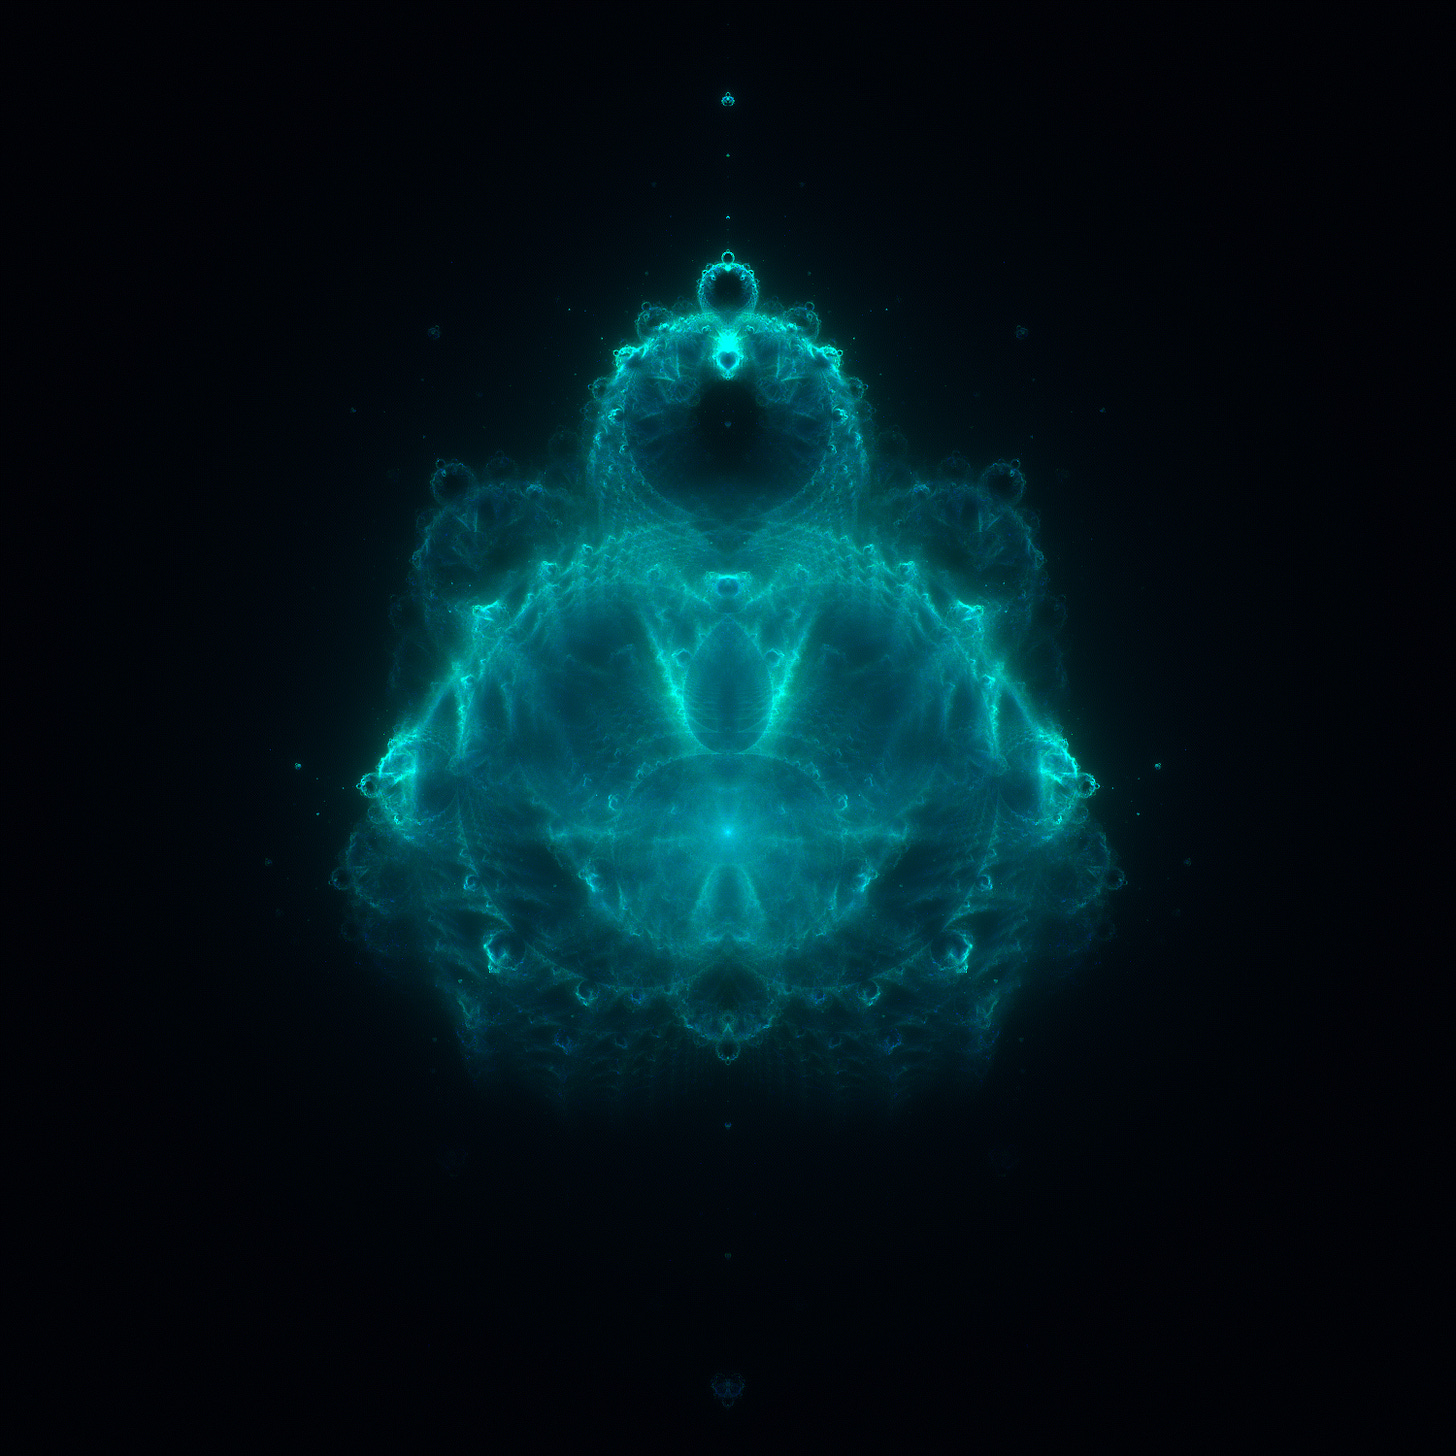
In technical terms, the set is still calculated by iterating the same zn+1 = zn² + c formula over the same c = (u, v) range as for the Mandelbrot proper; the only difference is that we don’t color pixel c based on whether zn escaped or not. Instead, non-escaping trajectories that make up the interior of the Mandelbrot set are ignored altogether; escaping trajectories are recorded and have their zn = (xn, yn) coordinates overlaid on the screen. Each pixel of the final image is colored depending on how many times it’s been “visited” as a part of any of the escaping zn sequences. The value of c = (u, v) is used only as a part of the trajectory calculation itself.
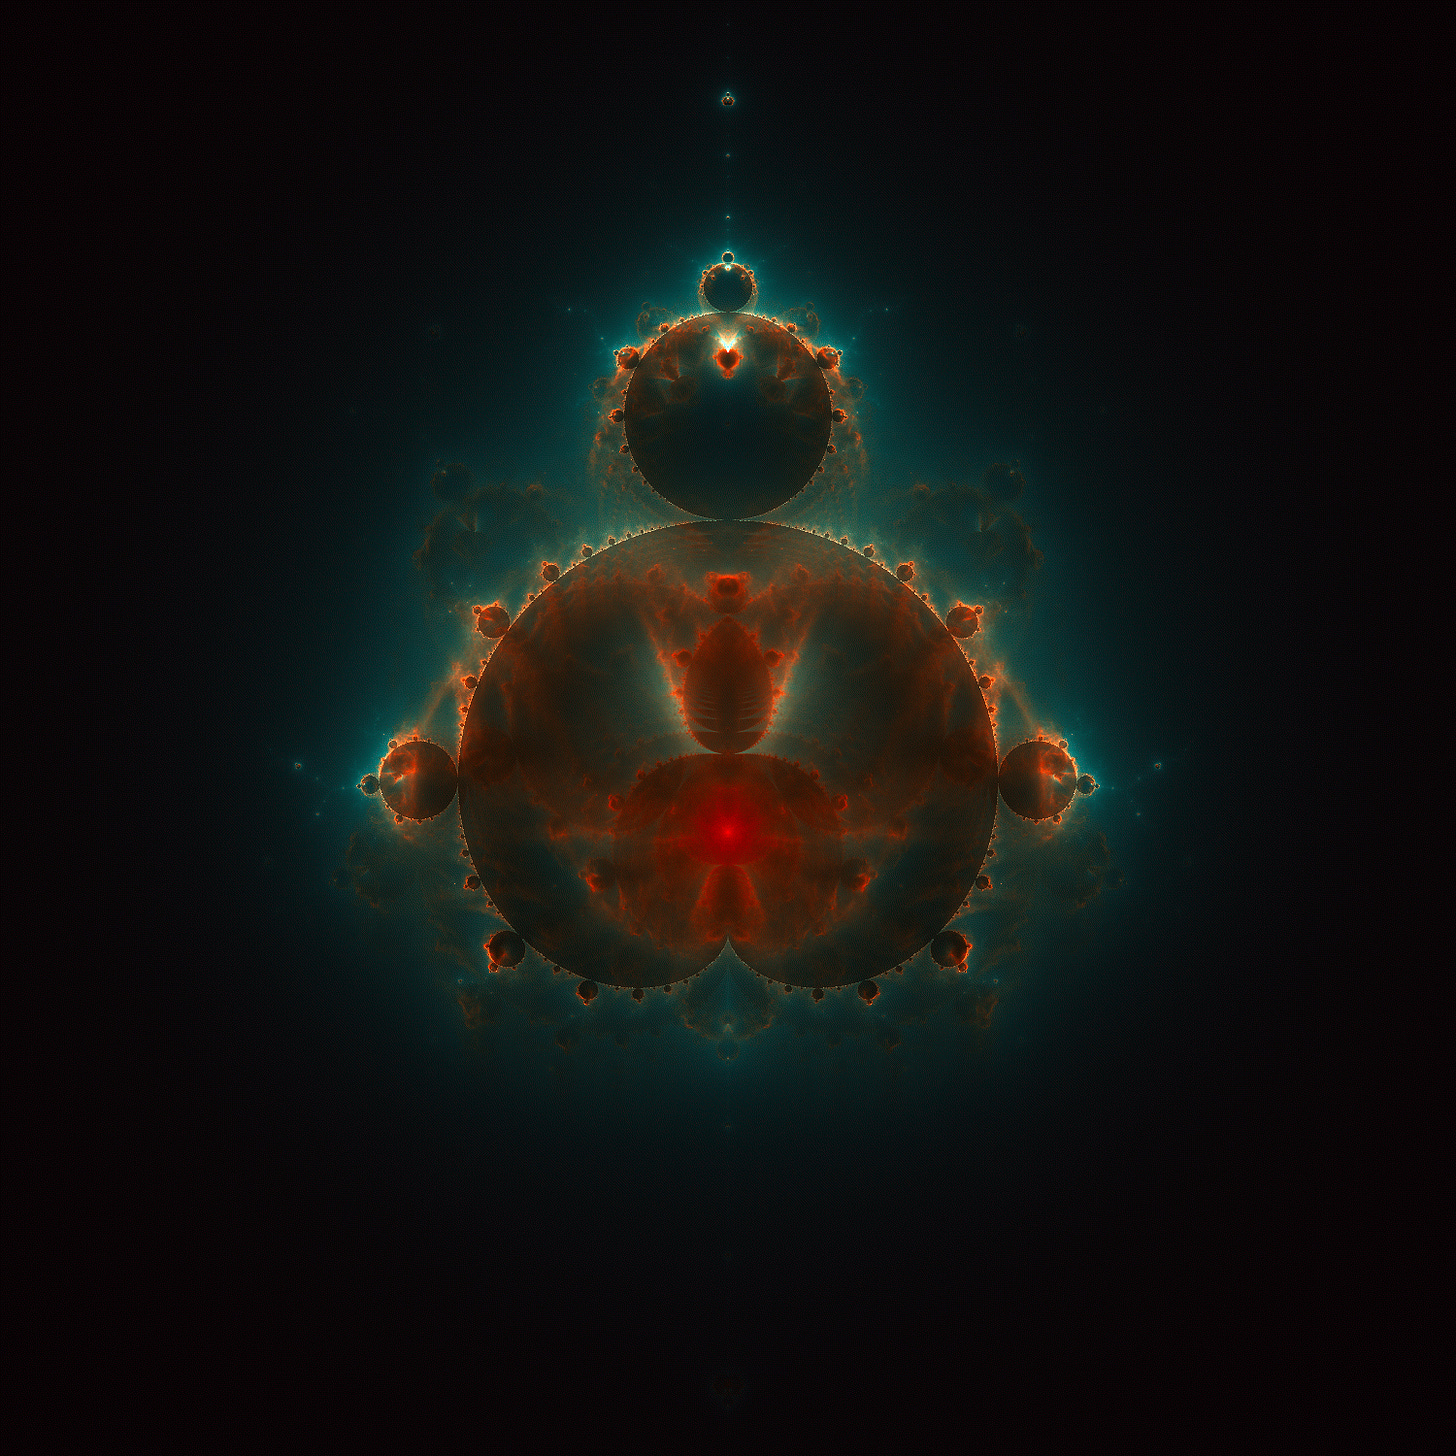
Compared to the famed Mandelbrot set, this visualization — known as the Buddhabrot — is quite obscure. It is also notoriously difficult to compute; for example, two prominent renderings on Wikipedia are quite a bit off.
The main issue is the trajectories’ extreme sensitivity to starting conditions, exacerbated by the need to iterate the system for longer than necessary for most other fractals, just to make the “trail cloud” dense enough. To illustrate, let’s say that we’re starting with the traditional Mandelbrot algorithm. For every pixel, the original algorithm calculates the constant c = (u, v) based on some chosen pixel coordinate, then runs with that. Again, the only change is that we don’t use the result to decide the color of c; instead, we display the pixels in the iterated sequence zn.
Assuming we want the zero axis to go through the middle of the screen, the most intuitive conversion between integer pixel coordinates and floating-point c = (u, v) values would be this:
Alas, that division is a trap: we all know that the results can be inexact, but it’s less obvious that this loss of precision might not be symmetrical in respect to our newly-chosen zero point. Here’s a real example of the unexpected bias for xmax = 3,000:
For the Mandelbrot set, it’s not a big deal; it technically breaks symmetry — the pixel to the left of center is calculated for a slightly different set location than the one to the right of center — but the sub-pixel shift is not visually perceptible. For Buddhabrot, in contrast, we’re plotting zn itself, perhaps across one million iterations or so; a difference in the iteration constant can blow up easily, giving us two completely different paths through space.
Because of this, some Buddhabrot implementations modify the Mandelbrot algorithm and just choose c at random; throw enough darts, and you get a complete image without a consistent bias. You have a lot of broken symmetries, but the hope is that they visually cancel out. But that requires heavy oversampling; you need to compute far more trajectories than there are pixels on the screen.
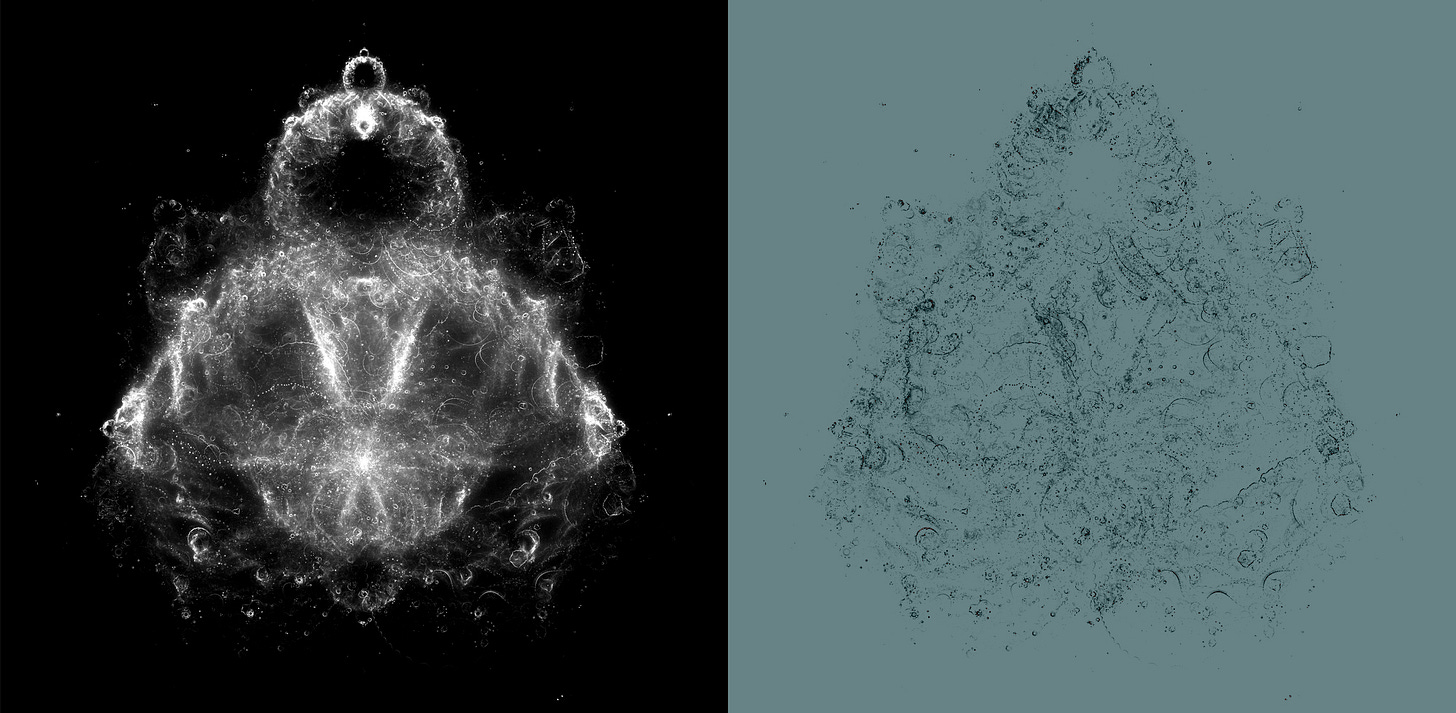
As a practical example of the symmetry issues you run into, consider the following Wikipedia image (left). It looks symmetrical at first sight, but if you flip it horizontally and subtract from the original, the amount of broken-symmetry pixels is actually quite high (right):
Another problem present in that Wikipedia rendering and many other online examples are sharply-delineated curved lines, halos, and circles in the plot. They’re not an intrinsic feature of the set: instead, they’re density discontinuities caused by the gaps caused by the the discrete stepover of (u, v) values — i.e., not enough oversampling, even if you get the symmetry right.
Indeed, with sufficient oversampling, these artifacts fade into the background:
If you’d like to experiment with this or similar fractals, I have a very concise implementation here. I used this code to generate all the images in this article, except for the Koch curve and the printout from the 1978 book.
Peace out,
👉 I also have a second article about the nature of the Mandelbrot set itself. For a thematic overview of articles on this blog, click here.
I write well-researched, original articles about geek culture, electronic circuit design, algorithms, and more. This day and age, it’s increasingly difficult to reach willing readers via social media and search. If you like the content, please subscribe!







Bonus clip: ghost rabbit - the disintegration of Buddhabrot:
https://vimeo.com/936851633/f42a67b851
High-res versions of the last Buddhabrot:
https://lcamtuf.coredump.cx/fractals/buddhabrot_shadow.jpg (with Mandelbrot overlay)
https://lcamtuf.coredump.cx/fractals/buddhabrot_no_shadow.jpg (w/o overlay)
There are 112 major points. If you can spot and highlight ...